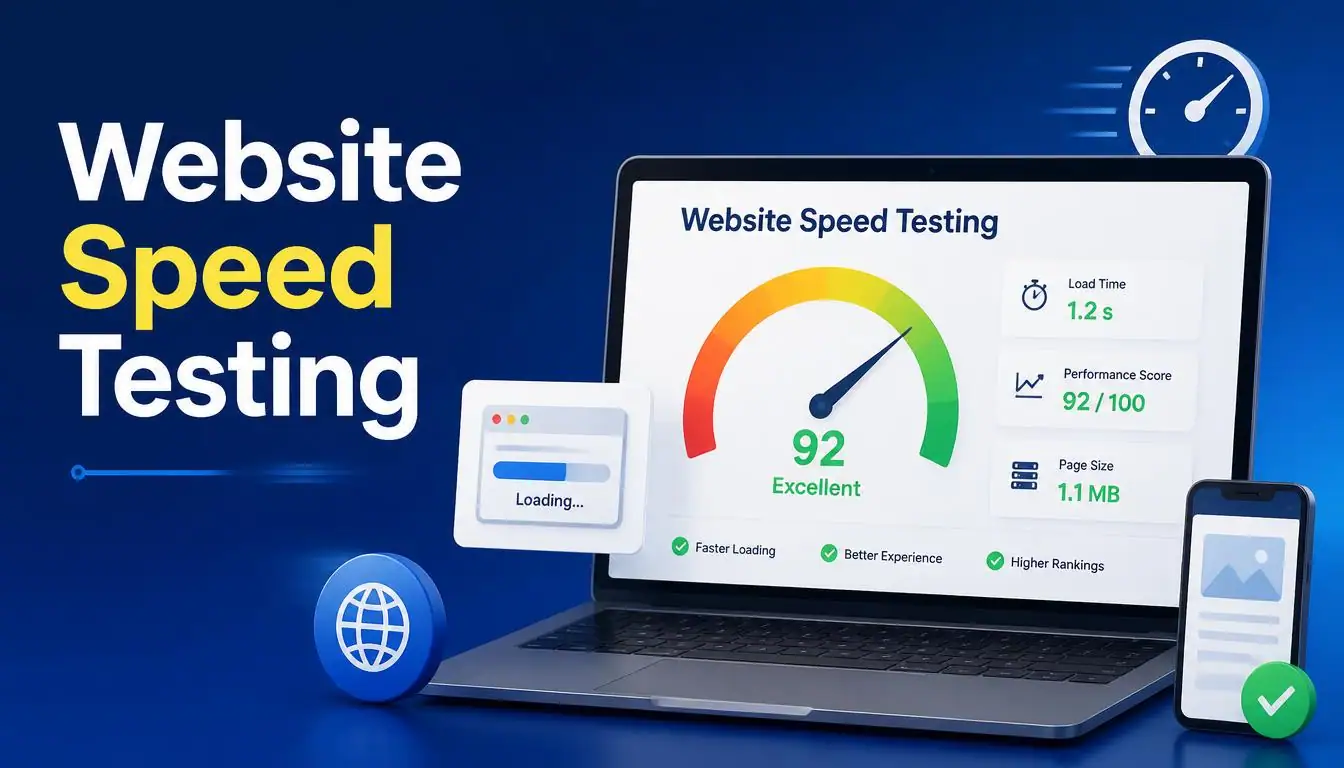
Website speed testing helps you understand what visitors experience from the moment they open a page. A website may look polished, but slow loading, delayed interactions or unstable elements can still affect user experience, conversion, retention and search engine rankings.
Testing also shows how website performance changes across devices, browsers, operating systems, internet connections and locations. By using the right tools and testing methods, you can identify performance issues, improve page loading speed and create a more reliable experience for every user.
Why site speed is so important
Website speed affects how smoothly customers can use a web page, how easily a business can maintain online visibility and how well its content performs in search engine rankings. Website speed testing shows whether page loading speed remains consistent across different devices, browsers, operating systems, access type and internet connection.
Long loading times often lead to a higher bounce rate, weaker conversion and lower retention. This becomes especially important for international users, who may not have the same connection quality as local visitors. Large files and unoptimised images can also increase carbon emissions, making website performance part of a broader sustainability discussion.
Google’s Core Web Vitals
Google uses Core Web Vitals, commonly known as CWV, as performance metrics for measuring web page performance and page experience. Since page speed is a ranking factor, these signals can affect the search presence of an online business.
Largest Contentful Paint, or LCP, measures the loading time of the largest file or visible content element. First Input Delay, or FID, evaluates website interaction by measuring how quickly the page responds to a user action.
Cumulative Layout Shift, or CLS, measures page stability throughout the loading process. Unexpected layout shifts, slow animation speeds and delayed interaction speeds can make a website feel unreliable even when its basic website speed appears acceptable.
Diverse access
Users may reach a website through desktop computers, laptop computers, tablets and other devices. Website access can also vary according to mobile internet usage, browsers, operating systems and the quality of global internet access.
An efficient website should deliver swift loading without limiting content or damaging the customer experience. Testing cross-device performance and cross-browser compatibility helps identify whether a particular access type produces weaker website performance.
An international approach
International users may experience a website differently from customers in its home market. Business growth often depends on reaching leads, customers and partners across countries and regions, so global website access must be considered during website testing.
Mobile connection speeds in South Korea and the UAE may approach or exceed 200 Mbps in some conditions, while users in Guinea-Bissau or Ethiopia may rely on 1.2 Mbps connections. A content-heavy website that performs well on a fast connection can become difficult to use at different internet speeds.
Testing page loading under varied internet connection quality gives an international business a more realistic global outlook. It also reveals whether connection quality is preventing a global audience from accessing important content.
Conversion and retention
Customers rarely wait patiently for slow websites. When an online store has weak page performance, website frustration can quickly interrupt the buying journey and damage customer retention.
Research commonly associated with Akamai and online shoppers shows how sharply bounce rate can rise as page loading time increases. Moving from one second to three seconds has been linked with a 32% increase in bounce probability, while reaching five seconds has been associated with a rise of around 90%.
These figures should be treated as practical indicators rather than universal outcomes. The main point is that poor performance creates unnecessary resistance. Faster loading times support conversion, reduce abandonment and create a more streamlined user experience in a market where competition is already high.
Ongoing sustainability
Websites consume energy whenever servers process requests and visitors download content. Slow loading, large files and oversized images can increase energy consumption while adding to a business carbon footprint.
Website speed testing can therefore support long-term sustainability as well as usability. Page optimisation, file optimisation and website speed improvement reduce unnecessary data transfer, lower environmental impact and contribute to a more sustainable website.
Website speed testing methods
Different website speed testing methods reveal different parts of page performance. Page speed testing may include waterfall analysis, scoring, visual reports and detailed page metrics.
No single testing approach explains every performance issue. Combining testing tools helps you understand loading speed, loading behaviour and how individual website assets affect the overall experience.
Waterfall analysis
Waterfall analysis presents a visual map of everything a web page loads. The waterfall chart normally lists page assets such as files, code, CSS, JavaScript, HTML, images, videos, plugins, app integrations and third-party content.
Each line shows how an asset moves through blocking, sending, waiting and receiving. This makes the loading order easier to understand and shows which requests delay other resources in the user browser.
A website speed test with waterfall analysis can uncover large media files, inefficient coding or external services that hold back page performance. It is especially useful for performance tracking because it reveals not only loading speed, but also how asset loading happens.
Scoring
A website speed score usually converts webpage performance into a performance score on a 1-100 scale. This overall value provides a useful base level for comparison, but it should not be treated as the only measure of quality.
Scoring helps identify website elements that are performing well and underperforming elements that need tweaks or adjustments. The detailed performance analysis is usually more useful than score improvement alone because it provides actionable insight.
Use performance benchmarks to measure progress after optimisation. A higher score is valuable when it reflects genuine improvements for users rather than changes made only to satisfy a testing tool.
Website speed testing best practices
Website speed testing best practices create more reliable testing procedures. Useful testing rules include running tests more than once, examining caching, using several speed testing tools and comparing device-specific tests.
Performance testing should also account for connection variables and user volumes. A balanced testing toolkit includes cached testing, non-cached testing and repeated checks under realistic conditions, giving you deeper performance insight.
Multiple runs
Multiple runs are necessary because page loading time can change according to the time of day, device, number of users and availability of external resources. A single result may reflect a temporary condition rather than normal website speed.
Run device-specific tests and compare page speeds during low user volumes and high user volumes. Repeated tests reduce the influence of short-term testing variables and provide maximum insight into website performance.
Testing consistency matters when comparing results. Use similar locations, connection settings and devices, then calculate or observe average performance rather than relying on the fastest result.
Caching
A user making a first website visit generally begins with a clean slate. Their device holds little or no prior information about the website pages, content, site information or user preferences.
After that visit, the browser cache may store selected resources. A returning user can then receive faster access because some files are loaded from a cached version instead of being downloaded again.
Test both a cached version and a non-cached version to understand real website performance. Caching protocols can improve page loading for returning customers and repeat visits, but they should not hide a poor first-load experience.
Your testing toolkit
A useful testing toolkit examines website speed testing from both a technical and customer perspective. Performance testing tools should reveal how customers experience website usability while also providing enough technical insight to locate the cause of a problem.
Google tools are helpful for search-related analysis, while third-party tools can add different locations, apps, monitoring options and testing methods. Combining them creates a stronger testing process for speed analysis, performance monitoring and customer experience.
Google’s website load time testing tools
Google provides several testing tools for examining website load time, page loading times and factors related to search engine rankings. These include Chrome DevTools, PageSpeed Insights, Lighthouse, Search Console and Google Analytics.
Each Google website speed test serves a different purpose. Some generate synthetic data in controlled conditions, while others use field data collected from real visits. Together, they support Core Web Vitals analysis and ongoing performance monitoring.
Chrome Dev Tools
Chrome DevTools is a collection of free tools built into Google Chrome. Similar development tools are also available in Firefox and Safari, and Chrome can be used on Microsoft systems, Linux and Apple Mac OS.
Open the DevTools window with Ctrl+Shift+I or F12 on many Windows and Linux devices. On a Mac, use Option+Command+I. Select the Network tab before beginning website speed testing.
Start page speed recording with the record button or Ctrl+E, then reload the page. The website performance recording will list page elements and performance values such as element size, delivery time, MIME resource type, HTTP method and referrer.
The HTTP method may appear as GET or POST depending on how the browser and server communicate. Each server request can be inspected to understand where the resource came from and how long it took to arrive.
The waterfall view separates loading activity into blocking time, sending time, waiting time and receiving time. It also displays loading order, making it easier to spot slow server content, PHP scripts, HTML code and oversized resources.
At the bottom of the Network tab, Chrome DevTools may show total page loading time and DOMContentLoaded timing. These values help explain when the page structure became available and when user interaction could begin.
DevTools can also produce a website performance report with actionable recommendations. An exported report or saved profiles can help developers compare changes without losing the original test data.
PageSpeed Insights
PageSpeed Insights is a Google website speed test tool designed for both beginner testing and advanced testing. Enter a URL to run a direct page load speed test and receive a performance overview.
The PSI score is shown as an overall score on a 1-100 score scale. Colour coding helps separate strong results from areas requiring attention, although the number itself should not be confused with search position.
PageSpeed Insights combines Google Core Web Vitals information with the Chrome User Experience dataset, known as CrUX, and analysis from the Google Lighthouse API. This gives users a mixture of Field Data and controlled laboratory results.
Field Data is a form of RUM based on real visits where sufficient information is available. It can reveal how actual users experience a page across different devices and network conditions.
The URL analysis also lists performance factors, data values, opportunities and diagnostics. These performance recommendations help improve website usability and page experience rather than focusing only on the PSI score.
Lighthouse
Lighthouse is a free website performance tool and website speed test tool maintained by Google. It can run through a Chrome extension, DevTools, the command line or a Node module.
Its reports examine performance, accessibility, best practices, SEO and progressive web apps. Each category uses a 1-100 scale and includes recommendations and diagnostics.
Lighthouse works as a synthetic monitor rather than a direct source of real user data. Real-world datasets may cover a previous period such as 28 days, while Lighthouse generates a controlled result at the time of testing.
Tests often use simulated throttled connections and a device profile based on a Moto G4, a 2016 phone that represents a relatively low-power phone. This creates a useful worst-case scenario for identifying problems that may not appear on a powerful desktop computer.
The report covers Google Core Web Vitals as well as website accessibility and user experience. Select Measure after choosing the required settings to begin the audit.
Search Console and Analytics
Search Console presents page speed metrics through the Core Web Vitals report. Google groups site performance into Poor, Needs Improvement and Good categories, then organises affected pages into URL groups.
These aggregate scores offer top-level data for identifying site-wide patterns. Individual URL data can then be examined through PageSpeed Insights when more detailed analysis is needed.
The CrUX report supports field data analysis and helps explain page performance factors affecting real visitors. Search Console is particularly useful for website monitoring because it can reveal ongoing speed issues across groups of similar pages.
After a fix, allow for the reporting period required by the platform. A 28-day post-fix monitoring window may be needed before enough new data is available to confirm the change.
Google Analytics is another analytic tool that can provide historical data about loading times and website performance changes. Depending on the setup and version in use, it may support page speed over time, Speed Suggestions and average user timings.
Older implementations involving Analytics.js may also contain timing information related to user interaction. Use this alongside RUM, Search Console and individual page analysis rather than treating it as a replacement for direct testing.
Other web page speed-testing tools
Other web page speed-testing tools can supplement Google features with additional insights. Popular options include GTmetrix, Pingdom, WebPageTest, Uptrends, Bytecheck and k6, formerly known as LoadImpact.
These platforms cover different areas of performance testing, including synthetic monitoring, real user monitoring, waterfall reports and server testing. The most useful option depends on whether you need a quick audit, ongoing monitoring or traffic simulation.
GTmetrix
GTmetrix is a freemium website performance test tool suitable for beginners and experienced users. Its free version covers basic analysis, while the pro version adds mobile performance testing, global monitoring, API access and broader configuration options.
Reports include graphs, page-load videos and slow motion playback. These features make page performance changes easier to see because you can watch how visible content appears during loading.
Scheduled testing and alerts can track selected page metrics against predefined levels. This is useful when a website changes frequently or relies on external services.
Configurations may include countries, jurisdictions, connection speeds, browser types, operating systems and simulated devices. Depending on current availability, testing locations may include Australia, Brazil, Canada, China, India, the UK and the USA.
Free testing locations are more limited than those included with a premium subscription. Select locations and user access devices that closely represent the audience before interpreting the website performance report.
Pingdom
Pingdom is a freemium product offering free demos, a free trial and several subscription pricing tiers. Its basic testing features can run a website speed test, while paid plans provide broader checks and monitoring.
The service can combine RUM data with synthetic data. Synthetic monitoring is useful for checking repeatable actions such as user registrations and shopping cart checkouts from simulated locations.
Real user monitoring provides real-time insights into ongoing website performance. Uptime monitoring can also show when a page or service becomes unavailable rather than merely slow.
Intermediate users and advanced users may use Pingdom to track KPIs, SLAs and performance targets across hundreds of sites, services, tools, apps and portals.
The platform also offers an API, implementation support and systems integration options. These features are more valuable for organisations needing ongoing monitoring than for someone running a single manual test.
WebPageTest
WebPageTest is a free webpage speed testing tool known for its waterfall design. It supports simple testing for beginners while also providing advanced features for technical users.
The intuitive interface includes Core Web Vitals, visual comparisons, graphs, video capture and a detailed waterfall report. Advanced configurations allow multiple runs, different connection types, browser versions, devices and simulated testing conditions.
Tests can run from global locations, making it easier to compare technical metrics with the likely real user experience of audiences in different regions.
WebPageTest began at AOL in 2008 and later became associated with Catchpoint. It has been used to analyse web properties ranging from small sites to high-profile websites.
Catchpoint also offers a broader digital experience monitoring platform with real-world monitoring and synthetic monitoring. Developers can use the WebPageTest API for system integration and automated workflows.
As an open-source tool, WebPageTest remains useful even alongside competing products. Its combination of advanced testing, load times, filmstrips and network details makes it one of the strongest options for diagnosing complex loading behaviour.
Uptrends
Uptrends provides a website speed testing tool as part of a wider testing suite. It offers a 30-day free trial, a limited free tool and a premium subscription with advanced features.
The intuitive interface works for beginners, while developers can inspect detailed page metrics and recommended improvements. Reports may include a Google PageSpeed Insights score as well as the platform’s own scoring methodology.
A page-load progression report presents resources in a waterfall format. Depending on current support, tests may use Chrome, Firefox, Internet Explorer or Phantom JS, along with selected browser versions.
Simulated throttling allows you to compare connection speeds and simulated testing locations. The free service may provide around 10 free locations, while premium access can extend to as many as 228 premium locations.
Remote teams can use collaborative features such as the Share Results button. Uptrends also supports automation and scheduled website speed tests for round-the-clock testing, including checks at five-minute intervals on eligible plans.
Beyond pages, the platform can assist with website monitoring for applications, APIs and servers. Its final performance report is most useful when tests are run under conditions that match the actual audience.
Bytecheck
Bytecheck is a free tool designed to provide a quick overview of website loading speed. Its simple layout makes it suitable for beginners who want a basic tool without complex configuration.
The report highlights Time to First Byte, or TTFB, which can help indicate web hosting speed. It may also show total loading time, SSL certificate status and component loading times.
A simplified waterfall format displays loading order together with details such as header size, request size, download speed, upload speed and HTTP code.
Bytecheck may provide performance tips, a performance score and a star rating from one to five. Some recommendations can reference premium third-party services, so evaluate them separately from the main website speed testing report.
k6 (formerly known as LoadImpact)
k6, formerly known as LoadImpact, focuses on server speed testing and performance under traffic. Instead of examining only one page visit, it can run visitor simulation to measure how server responses change as website load increases.
This type of load testing helps identify website errors, website delays and weak server capacity before unexpected demand reaches a live site. It is useful for website optimisation because a page may load quickly for one visitor while slowing down under heavier traffic.
A free load test trial may include a limited allowance such as 50 cloud tests, while broader usage requires a subscription. Current plan limits should be checked before selecting a service.
k6 is primarily built for developers because effective tests require scripting knowledge. JavaScript is used to define real-world connections, access scenarios and automated tests.
These tests provide ongoing insights into page loading speed under controlled demand. They complement SEO tools by showing whether infrastructure can maintain acceptable performance when many visitors arrive at once.
Common mistakes when website performance testing
Common mistakes in website performance testing include ignoring geographical breakdowns, relying on one test and comparing different tools as though they use identical testing methods.
Performance variations may come from different locations, server requests, response times or synthetic monitoring settings. Repeated testing and average results provide stronger testing accuracy than a single report.
Performance reports can also contain confusing values. Establish clear benchmarks before running website speed tests, then compare results under similar conditions.
Geographical breakdowns
Users in different customer locations and client locations may not receive the same experience. Distance from the server, country-level infrastructure and connection quality can all affect regional performance.
Use simulated geographical access points and synthetic monitoring to compare website speed from several testing locations. Global testing helps identify location variations that may not be visible from your own office or home connection.
The goal is not to make every result identical. It is to confirm that website performance remains usable for the regions that matter to the business.
Different results from different tools
Different website speed tests often produce different values because they use different testing methods, devices, locations and timing rules. Some tools begin measuring server requests earlier, while others calculate server responses or visual completion differently.
Avoid treating a single result as the complete truth. Run repeated tests and consider the average result rather than choosing only the quickest response time.
Use multiple tools when you need a more accurate performance picture. General benchmarks are useful for performance improvement, but compare results within the same platform before judging progress.
Measurement differences do not mean the testers are necessarily inaccurate. They usually show that each performance report is describing the page from a different technical perspective.
What is measured? Website speed testing jargon explained
Website speed testing jargon includes many acronyms, KPIs and performance labels. Understanding this speed testing terminology makes performance results easier to interpret.
Testing tools may display TTFB, rendering milestones, interaction delays and network measurement values. Each metric represents a different part of page performance, so technical metrics should be read together during monitoring.
What is TTFB (Time to First Byte)?
TTFB means Time to First Byte. It measures the interval between the browser HTTP request and the arrival of the first byte from the server.
A slow website response time can come from web hosting, network latency, backend processing or an inefficient server response. TTFB therefore helps assess hosting performance, but it does not represent the complete page speed.
What is SSL (Secure Socket Layer)?
SSL stands for Secure Socket Layer, a security technology that created a protective layer between the application layer and transport layer of an internet connection.
Modern https connections generally use Transport Layer Security, or TLS, which succeeded SSL. However, the term SSL certificates is still commonly used when discussing website encryption.
The browser uses this protection to support information security and secure communication. SSL is essential for trust, but the configuration and certificate negotiation may also affect connection timing.
What is Ping / Ping Speed?
Ping measures request response time between a device and another network location. Ping speed is normally shown in milliseconds and represents latency rather than complete website loading time.
A website speed test may include Ping to help evaluate internet connection quality, network response and server communication. Lower latency usually indicates stronger connection performance.
What is Packet Loss?
Packet loss occurs when some data sent across an internet connection fails to reach its destination. Ping speed tests may identify lost data packets alongside request response time and latency.
High packet loss reduces network reliability and connection quality. It may cause interrupted website interaction even when the reported speed in milliseconds appears acceptable.
What is PDV (Packet Delay Variation)?
PDV means Packet Delay Variation. It measures how much packet timing changes during the connection duration and is commonly described as jitter.
High ping speed variation can make website interaction inconsistent for the end user. Stable latency matters for network stability, especially when connection performance affects live communication or interactive services.
What is Lossy / Lossless Compression?
Lossy compression reduces file size by permanently removing selected information from page components. It is commonly used for image files and video files where a small reduction in display quality may be acceptable.
Lossless compression reduces size while preserving the original data. It can be useful when visual accuracy or future editing matters.
Both methods can improve loading speed when applied correctly. Image optimisation and broader media optimisation create compressed assets that support website performance without making content look noticeably poor.
What is RTT (Round Trip Time)?
RTT means Round Trip Time. It measures the total time required for a data packet to travel to a destination and for an acknowledgement to return.
This value includes both the network request and network response. RTT is therefore a useful indicator of connection latency and overall data transfer delay.
What is RUM (Real User Monitoring) / Synthetic Monitoring?
RUM means Real User Monitoring. It collects live data from actual website users to show real user experience across devices, connection speeds and geographic locations.
Because RUM records real visits, it can provide historical data about webpage performance monitoring. However, results may vary widely because users do not all share the same conditions.
Synthetic monitoring uses machine-based testing with controlled settings. It can repeat the same connection speed simulation, location and device profile, making performance metrics easier to compare.
RUM explains what real visitors experienced, while synthetic monitoring helps explain why a problem may be happening. Using both creates a more complete performance picture.
What is Core Web Vitals: LCP (Largest Contentful Paint)?
LCP stands for Largest Contentful Paint. As part of Core Web Vitals and Google Page Experience updates, it measures when the largest content element becomes visible.
The largest content might be an image, video, font-based text block or another major element. LCP is a loading metric that helps describe perceived page load time and overall website performance.
What is Core Web Vitals: FID (First Input Delay)?
FID means First Input Delay. It measures the interaction delay between the first user input and the browser’s response.
That input may be a click or screen tap made while the browser screen is still loading. A low FID suggests stronger page responsiveness and smoother website interaction.
FID has historically been part of Core Web Vitals, although Google’s metrics can evolve. When reviewing reports, use the terminology and measurement currently shown by the testing platform.
What is Core Web Vitals: CLS (Cumulative Layout Shift)?
CLS stands for Cumulative Layout Shift. It measures page stability by tracking unexpected layout shifts while content is appearing.
Content movement can interfere with user actions, such as causing someone to click the wrong button during page loading. A lower CLS generally indicates stronger visual stability and better website usability.
What is FCP (First Contentful Paint)?
FCP means First Contentful Paint. It records when the browser display first shows meaningful visual content during page loading.
This may be the first text, first images or another visible element. FCP helps describe screen rendering and early loading performance, but it does not confirm that the full page is ready.
What is TTI (Time to Interactive)?
TTI stands for Time to Interactive. It estimates when an interactive page is ready for reliable user interaction after FCP.
A page may display content while clicking, typing or scrolling still feels delayed. TTI helps measure page responsiveness beyond the first visible loading milestone.
What is TBT (Total Blocking Time)?
TBT means Total Blocking Time. It measures blocked time on the main thread between FCP and TTI.
When a large file or heavy JavaScript processing occupies the browser for more than 50 milliseconds at a time, user delay can increase. The result may be a sluggish page or janky page that looks ready but does not respond smoothly.
Reducing TBT often requires examining processing time, script execution and unnecessary main-thread tasks. It is a useful laboratory metric for estimating website interaction and page responsiveness.
What is FCI (First CPU Idle)?
FCI means First CPU Idle. It was designed to estimate when the computer or browser had enough idle time to begin responding more consistently.
The metric examines CPU tasks, JavaScript, processing work and main thread availability during website loading. Some newer tools may no longer emphasise FCI, but the underlying idea of reducing long processing tasks remains relevant.
Site speed testing: FAQs
These frequently asked questions cover common areas of site speed testing, including the Google PageSpeed test, PageSpeed Insights, Lighthouse scores and page loading time.
They also address localhost speed testing, internet speed testing, free website speed testing tools, website usability, performance results and practical website optimisation.
Is the Google PageSpeed test reliable?
The Google PageSpeed test is reliable when its purpose is understood correctly. A PageSpeed Insights score summarises selected speed metrics, but it is not a complete judgment of webpage usability.
The performance score is a weighted score based on Lighthouse scores and measurements such as Total Blocking Time, Time to Interactive and First Contentful Paint. Page elements and render-blocking JavaScript can influence the numerical ratings.
Use the detailed recommendations to identify performance priorities and practical improvements. Image optimisation, script reduction and better loading behaviour may improve both website usability and website performance.
Google representatives such as Martin Splitt have repeatedly encouraged site owners to focus on the user experience rather than treating one score as the entire goal. The test is most useful when you analyse the underlying page loading time and recommendations.
Don’t get too hung-up on scores
Performance scores can feel like a competition in a gamified world, but a numerical rating is only one part of usability. A final score does not explain every real user problem.
Read the detailed recommendations and begin with practical improvements or low-hanging fruit. Image optimisation and obvious speed factors often provide more value than chasing minor scoring changes.
Martin Splitt and other Google representatives have emphasised the importance of website performance and user experience. Set performance priorities according to user impact rather than working only to increase a number.
Can I check the page speed of a website hosted locally?
A local website can be tested through the LocalHost property with a Lighthouse website speed test. Open the inspect window in Google Chrome using the F12 key or Ctrl+Shift+I.
Depending on the Chrome version, select the Audits tab or the Lighthouse panel and begin a Performance test. Use the Throttling option to simulate different connection speeds and internet connection types.
This type of browser testing is useful during local development because it reveals loading performance before the site becomes publicly accessible. Results should still be confirmed on live hosting because local website performance does not include the final server environment.
Which website is the best for testing internet speed?
Internet connection speed affects website design, website development and everyday tasks such as working from home. Free web-based internet tools can test connection performance directly through a web browser.
Speedtest.net and TestMy.net are commonly used by internet users and professionals. Both testing tools provide test results through a relatively simple user interface.
Look at download speed, upload speed and latency rather than relying on one value. These results describe your connection, not the speed of a specific website.
Which is the best free website speed testing tool?
There is no single best option for every use case. Google tools such as PageSpeed Insights and Lighthouse are strong starting points for evaluating website loading speed and Google search performance.
GTmetrix provides an accessible user-friendly interface, while Pingdom supports broader monitoring. WebPageTest is particularly useful for detailed page analysis and technical waterfall information.
These free website speed testing tools serve business owners and web developers with different levels of experience. Some advanced features require a subscription fee, even when basic testing is free.
John Mueller and other Google representatives have discussed performance as a broader experience rather than a single-tool target. Because testing methods produce different results, use tool suites and speed testing modules according to the problem being investigated.
Testing variety allows performance comparison across multiple conditions. The most useful tool is the one that provides the right performance metrics for your website optimisation work.
I’ve got my webpage speed test results – what next?
Webpage speed test results are useful only when they lead to action. Start by reviewing the testing system, performance analysis and the specific performance problems affecting website users.
PageSpeed Insights may recommend code optimisation, image optimisation, caching changes or improvements to website loading. Prioritise fixes that affect visible content and common user journeys.
Hosting also matters. A site on shared hosting may face resource limits, while Managed Hosting can provide better configuration or support depending on the provider.
Some providers promote a Website Acceleration Suite with features such as 40 settings or automated website acceleration. Evaluate these services according to the actual page speed fixes they provide rather than the number of options advertised.
After making changes, repeat website speed testing under the same conditions. This is the clearest way to confirm performance improvements and avoid assuming that every optimisation has worked.
What to do with your results
Organise website speed test results according to user impact and implementation priorities. Begin with performance issues that slow visible content, delay interaction or affect important conversion pages.
Testing analysis may point to page optimisation, code optimisation, image optimisation or caching. It may also reveal weak hosting performance or a slow server response.
Review JavaScript optimisation, CSS optimisation and HTML optimisation separately. Reducing unnecessary scripts, unused styling and excessive markup can improve loading without changing the purpose of the page.
Measure Core Web Vitals after each major change. Improvements should support user experience, conversion, bounce rate and search rankings rather than merely producing a higher laboratory score.
Website sustainability should also remain part of the process. Smaller resources and efficient delivery reduce data transfer while improving performance.
Use ongoing monitoring and stable performance benchmarks to catch regressions after plugins, design updates, advertising scripts or new content are added.
Conclusion
Website speed testing should be treated as an ongoing process rather than a one-time task. Regular tests help uncover slow server responses, large files, inefficient code, caching problems and changes that affect Core Web Vitals.
The most useful approach is to combine synthetic monitoring, real user monitoring and repeated tests across different devices and locations. Focus on practical improvements that make pages load faster, respond smoothly and remain stable for users. Better performance can support user experience, conversion, search rankings and website sustainability.
Frequently-asked questions
Common website speed testing questions often involve Google PageSpeed Insights, Lighthouse, localhost website testing and internet speed testing.
Other questions concern free speed testing tools, Core Web Vitals, performance scores and loading times. Browser tools can provide controlled technical tests, while connection speeds influence what users actually experience.
Synthetic monitoring is useful for consistent repeatable checks. Real user monitoring adds information from genuine visits, making the two approaches more valuable when used together.
WordPress Ping List 2026 : Which Ping Services Actually Help Indexing